LEARN
06
episode 6
CO2 Emissions are Increasing and the Earth is Suffering.
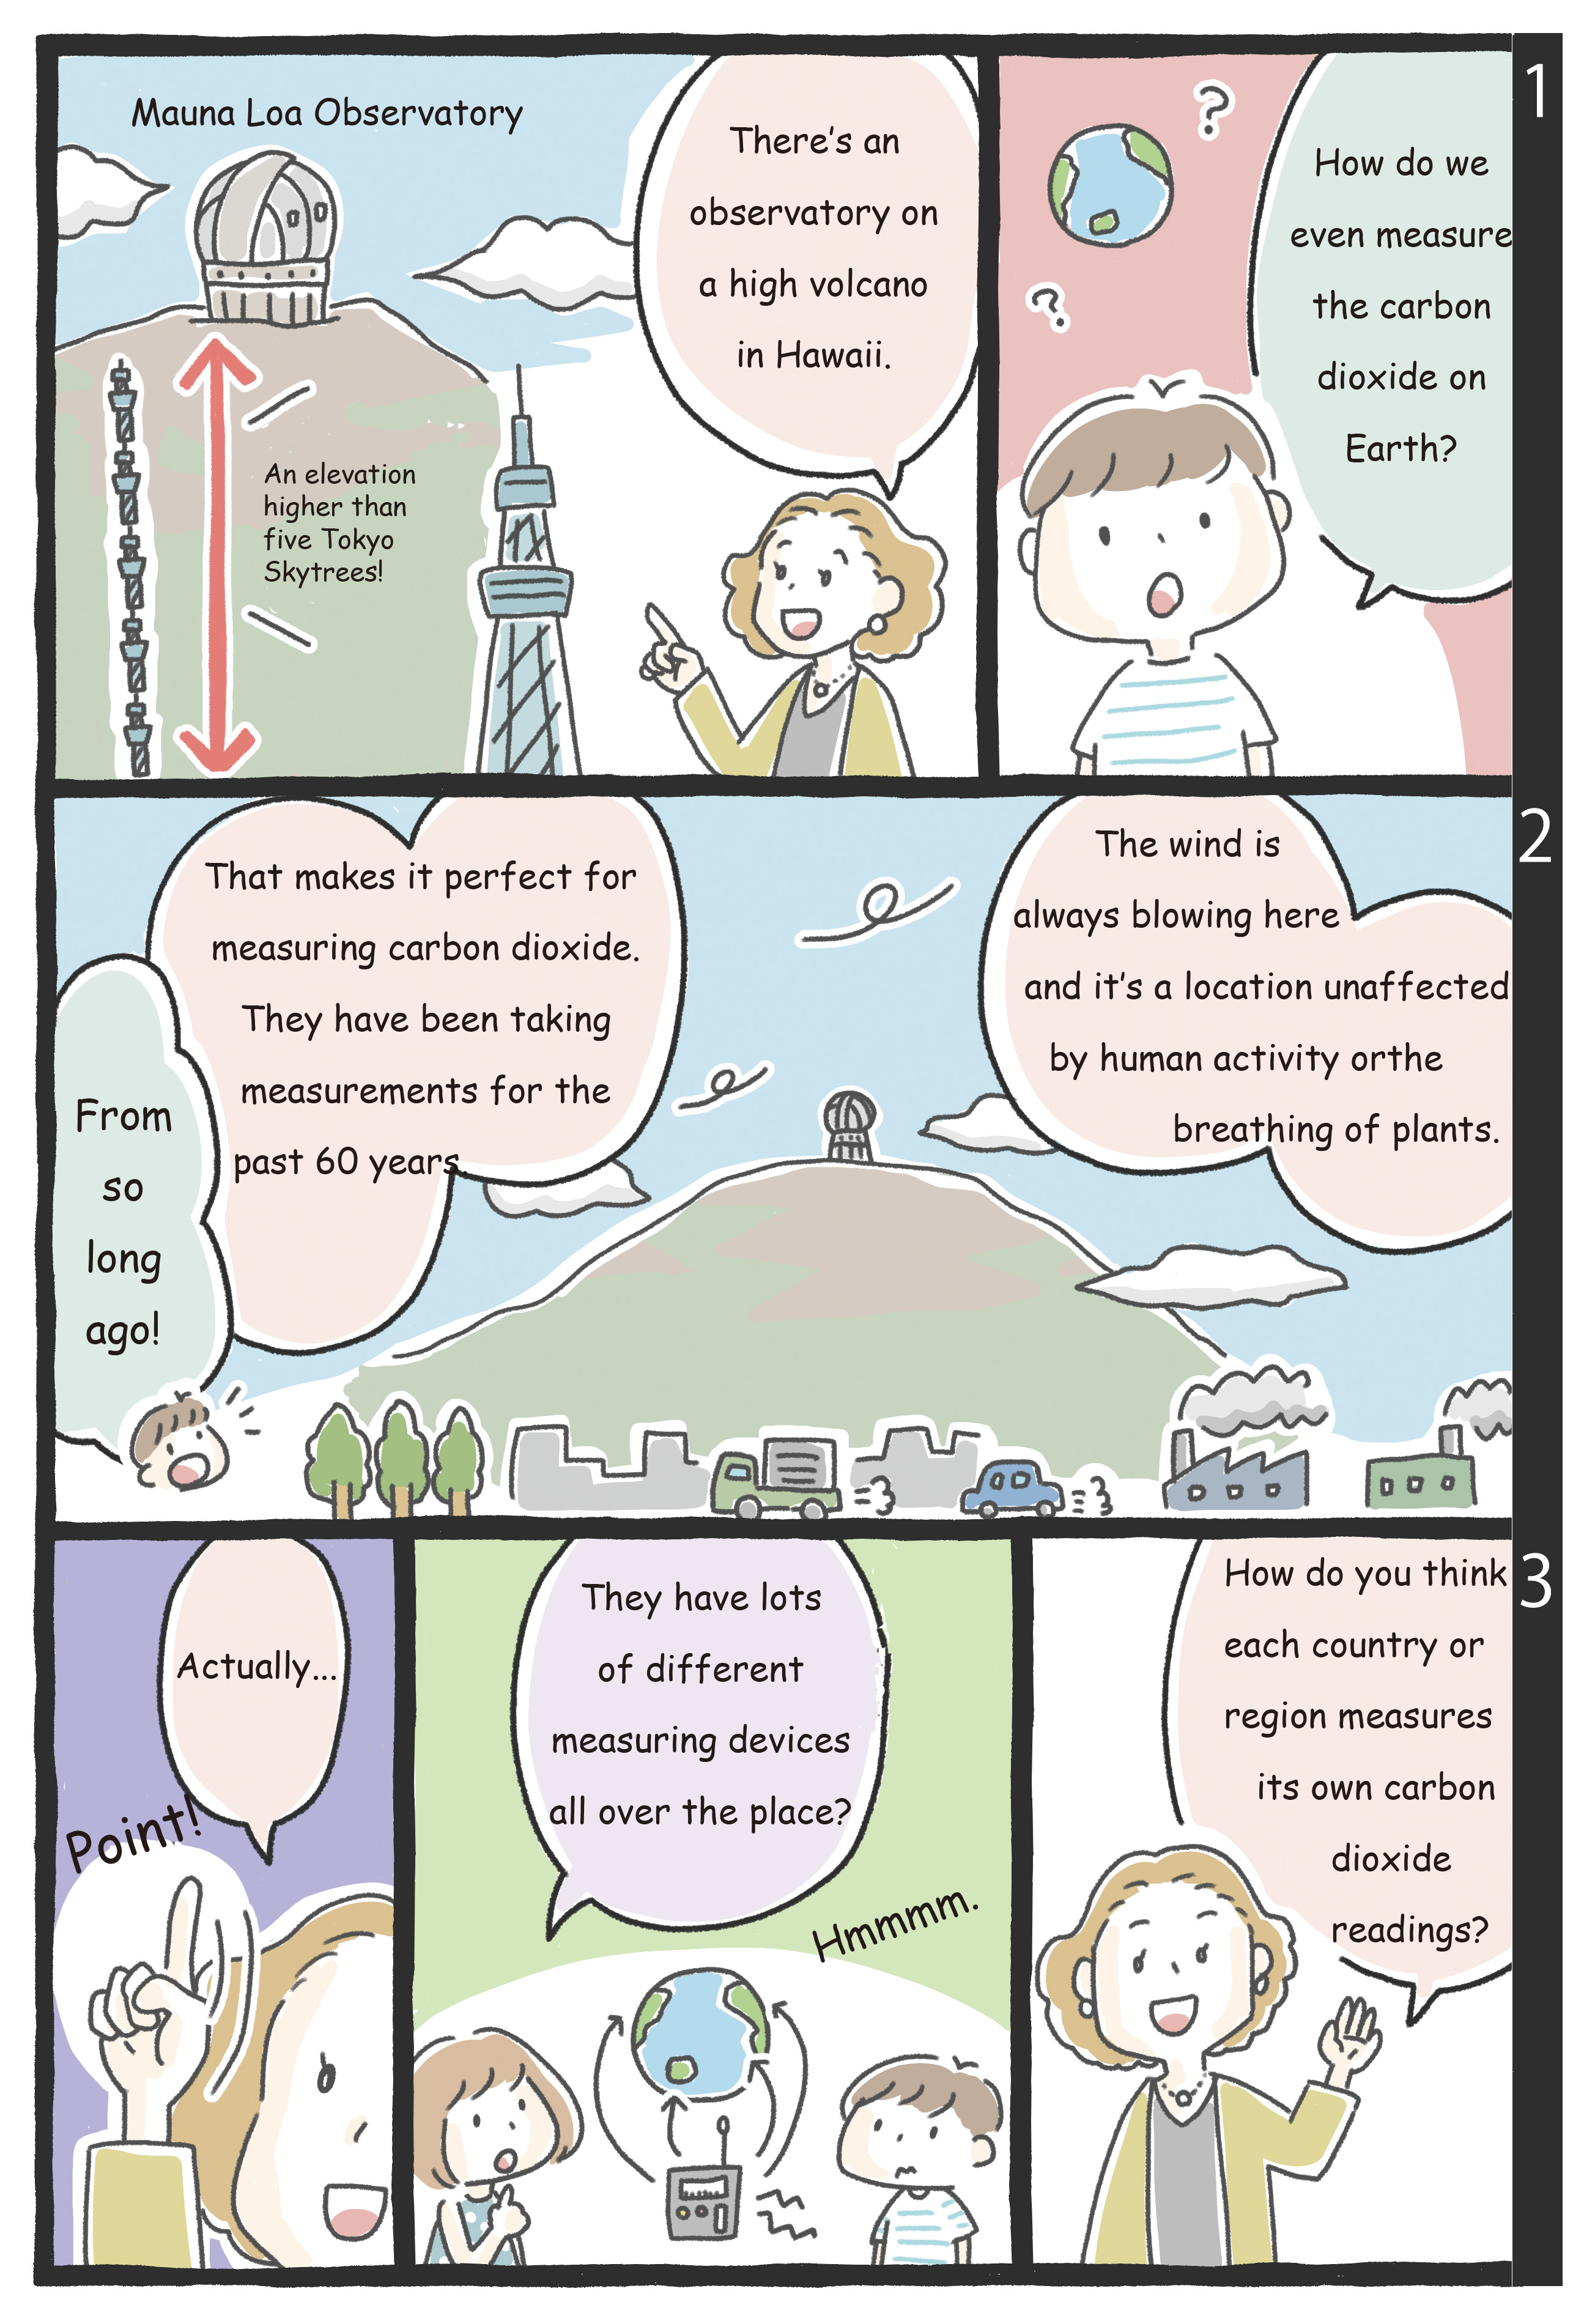
The islands of Hawaii are located in the middle of the Pacific Ocean, far from the continental United States, Asia, and Oceania. The summit of Mauna Kea on the Big Island of Hawaii is home to the Subaru Telescope and other observatories and telescopes from around the world. They are located here because the island is in the middle of the Pacific Ocean and has no large cities nearby, making it ideal for astronomical observations. For about 60 years now, carbon dioxide concentration has been observed at the Mauna Loa Observatory, another large volcano on the Big Island of Hawaii. Situated 3,400 meters above sea level, where the trade winds are constantly flowing and with no influence from human activity or plant respiration, it is an ideal place to measure the earth's carbon dioxide concentration.
Dr. Charles Keeling started his observation in 1958, and after only two years, he achieved outstanding results. For the first time, he was able to prove as fact that the concentration of carbon dioxide was rising, something that had only been a theory until that point.
Dr. Keeling's research continued, and his graphical depiction of the accumulation of carbon dioxide in the atmosphere, known as the "Keeling Curve," became the basis for subsequent greenhouse gas research. This Keeling curve showed that the concentration of carbon dioxide was increasing year on year.
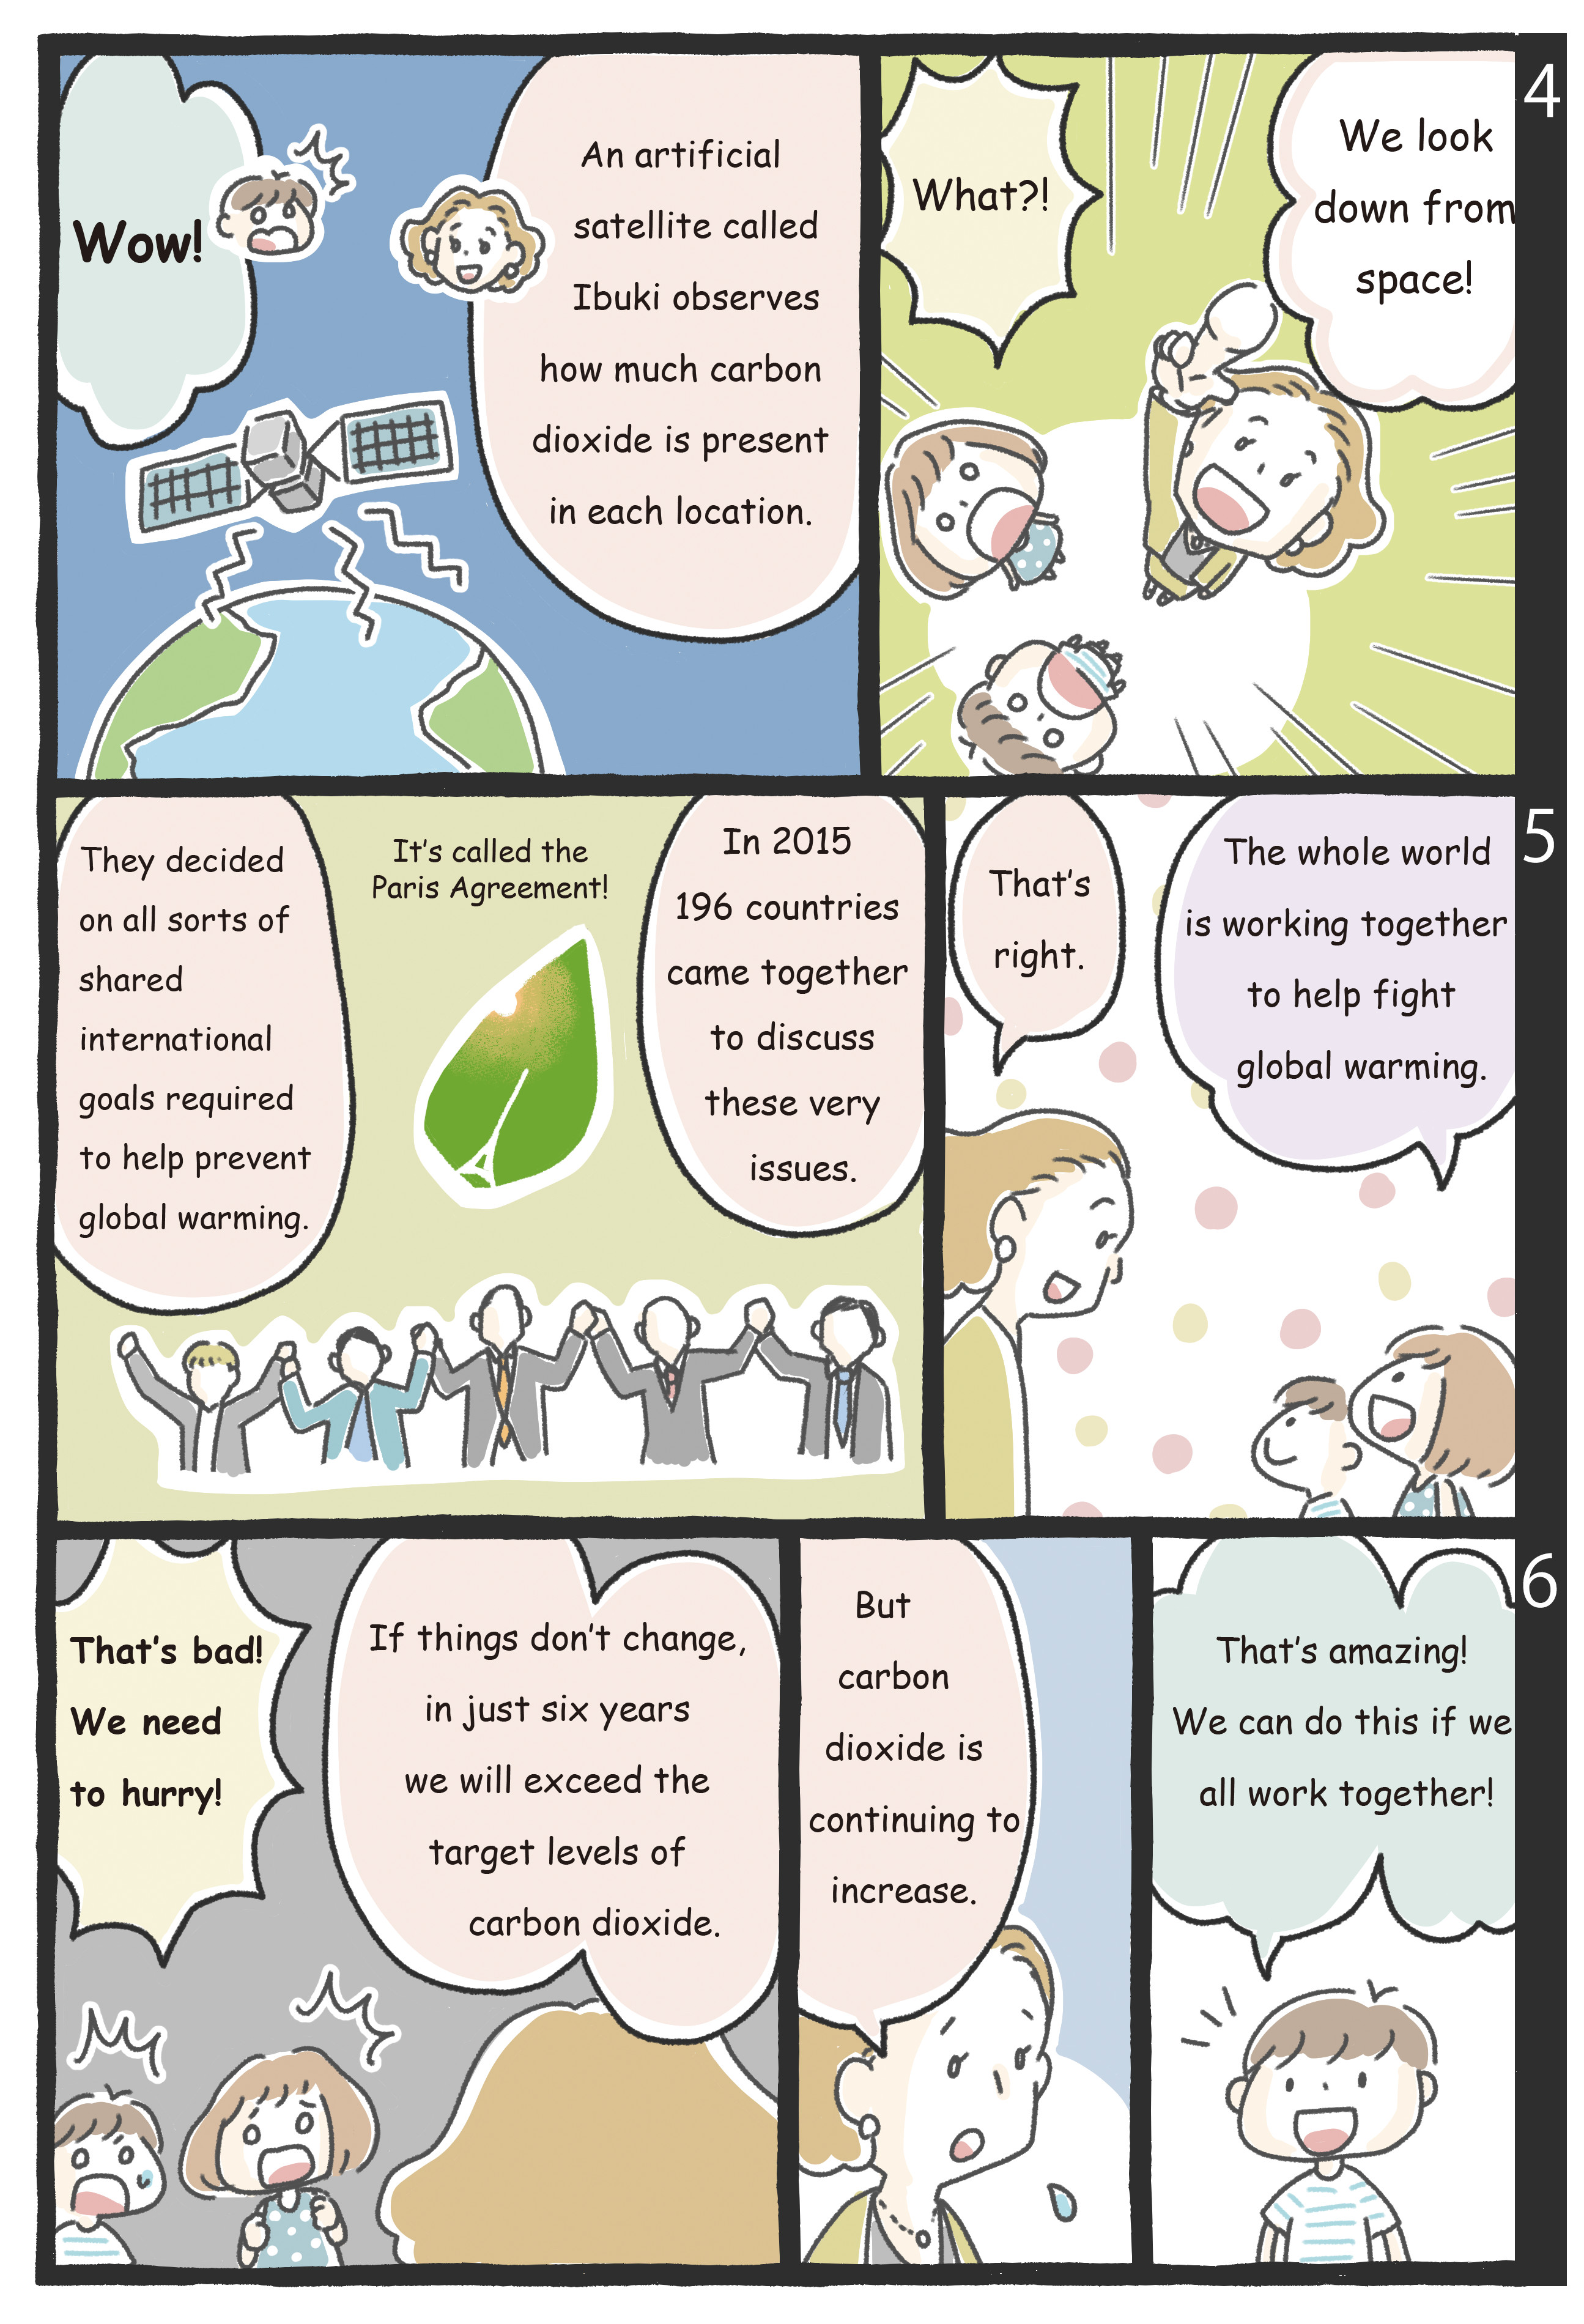
Today, carbon dioxide emissions around the world can be determined by the satellite "IBUKI" (GOSAT). IBUKI covers the globe every three days observing the concentration of carbon dioxide. These measurements enable us to know how much carbon dioxide is being emitted in each place on a global scale.
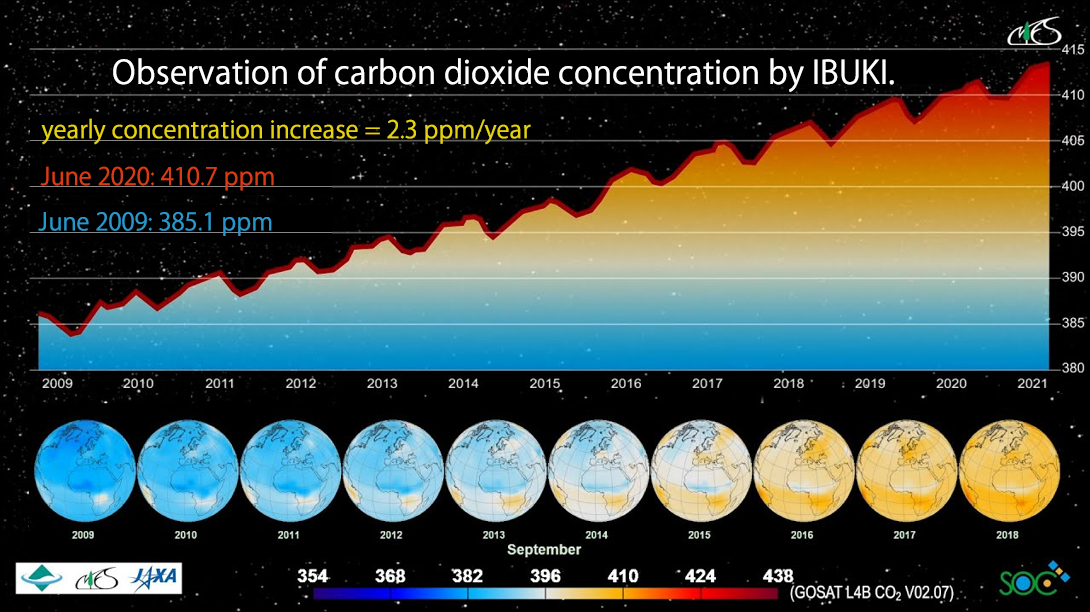
According to the latest data from IBUKI (December 2021), the global CO2 concentration is 415.0 ppm, and the increase in concentration from the previous year is 2.4 ppm.
In 2015, at the COP21 held in Paris, the Paris Agreement was signed. It states that "efforts will be made to keep the global average temperature increase significantly below 2°C above pre-industrial levels, and limit it to 1.5°C." To contain the increase to 1.5°C, the upper limit concentration of atmospheric CO2 is estimated to be around 430ppm. Based on the latest data from "IBUKI" mentioned above, at the current rate of increase, we have only 6 years and 3 months left until the CO2 concentration reaches 430ppm. Time is running out.
episode 6
CO2 Emissions are Increasing and the Earth is Suffering
Can be read horizontally on a large screen
×
Detailed data and explanation 1:
The Keeling curve.
Source: National Institute for Environmental Studies
(
https://www.nies.go.jp/kanko/news/28/28-5/28-5-04.html
)
The observatory on the summit of Mauna Loa on the Big Island of Hawaii was established in 1958, the International Year of Earth Observation. It was an ideal location because of its altitude above the forest limit, lack of vegetation, and distance from the continents. There, scientist Charles Keeling measured atmospheric mountain carbon dioxide and graphed its accumulation; in a 1960 paper, he presented the data and announced his discovery that carbon dioxide concentrations were increasing year by year worldwide. At the beginning of the observations, the concentration of carbon dioxide was about 315 ppm. This indicates that it was already 35 ppm more concentrated than the pre-industrial revolution level of 280 ppm. In the following 50 years, the rate of increase was even higher, doubling the concentration to 70ppm.
Detailed data and explanation 2:
Observation of carbon dioxide concentration by IBUKI.
IBUKI, the world's first satellite dedicated to greenhouse gas observation, has been constantly observing the entire Earth over a three-day period. This enables us to determine the status of carbon dioxide concentrations at key locations around the planet.
The movie below is a visualization of the status of green house gases based on observation data, showing changes in concentration from 2009 to 2020. And you can see that the monthly average concentration is increasing year by year with seasonal variations.
Source: National Institute for Environmental Studies video channel