LEARN
02
episode 2
Heavy Rains, Heat Waves, and Extreme Weather Events are on the Rise.
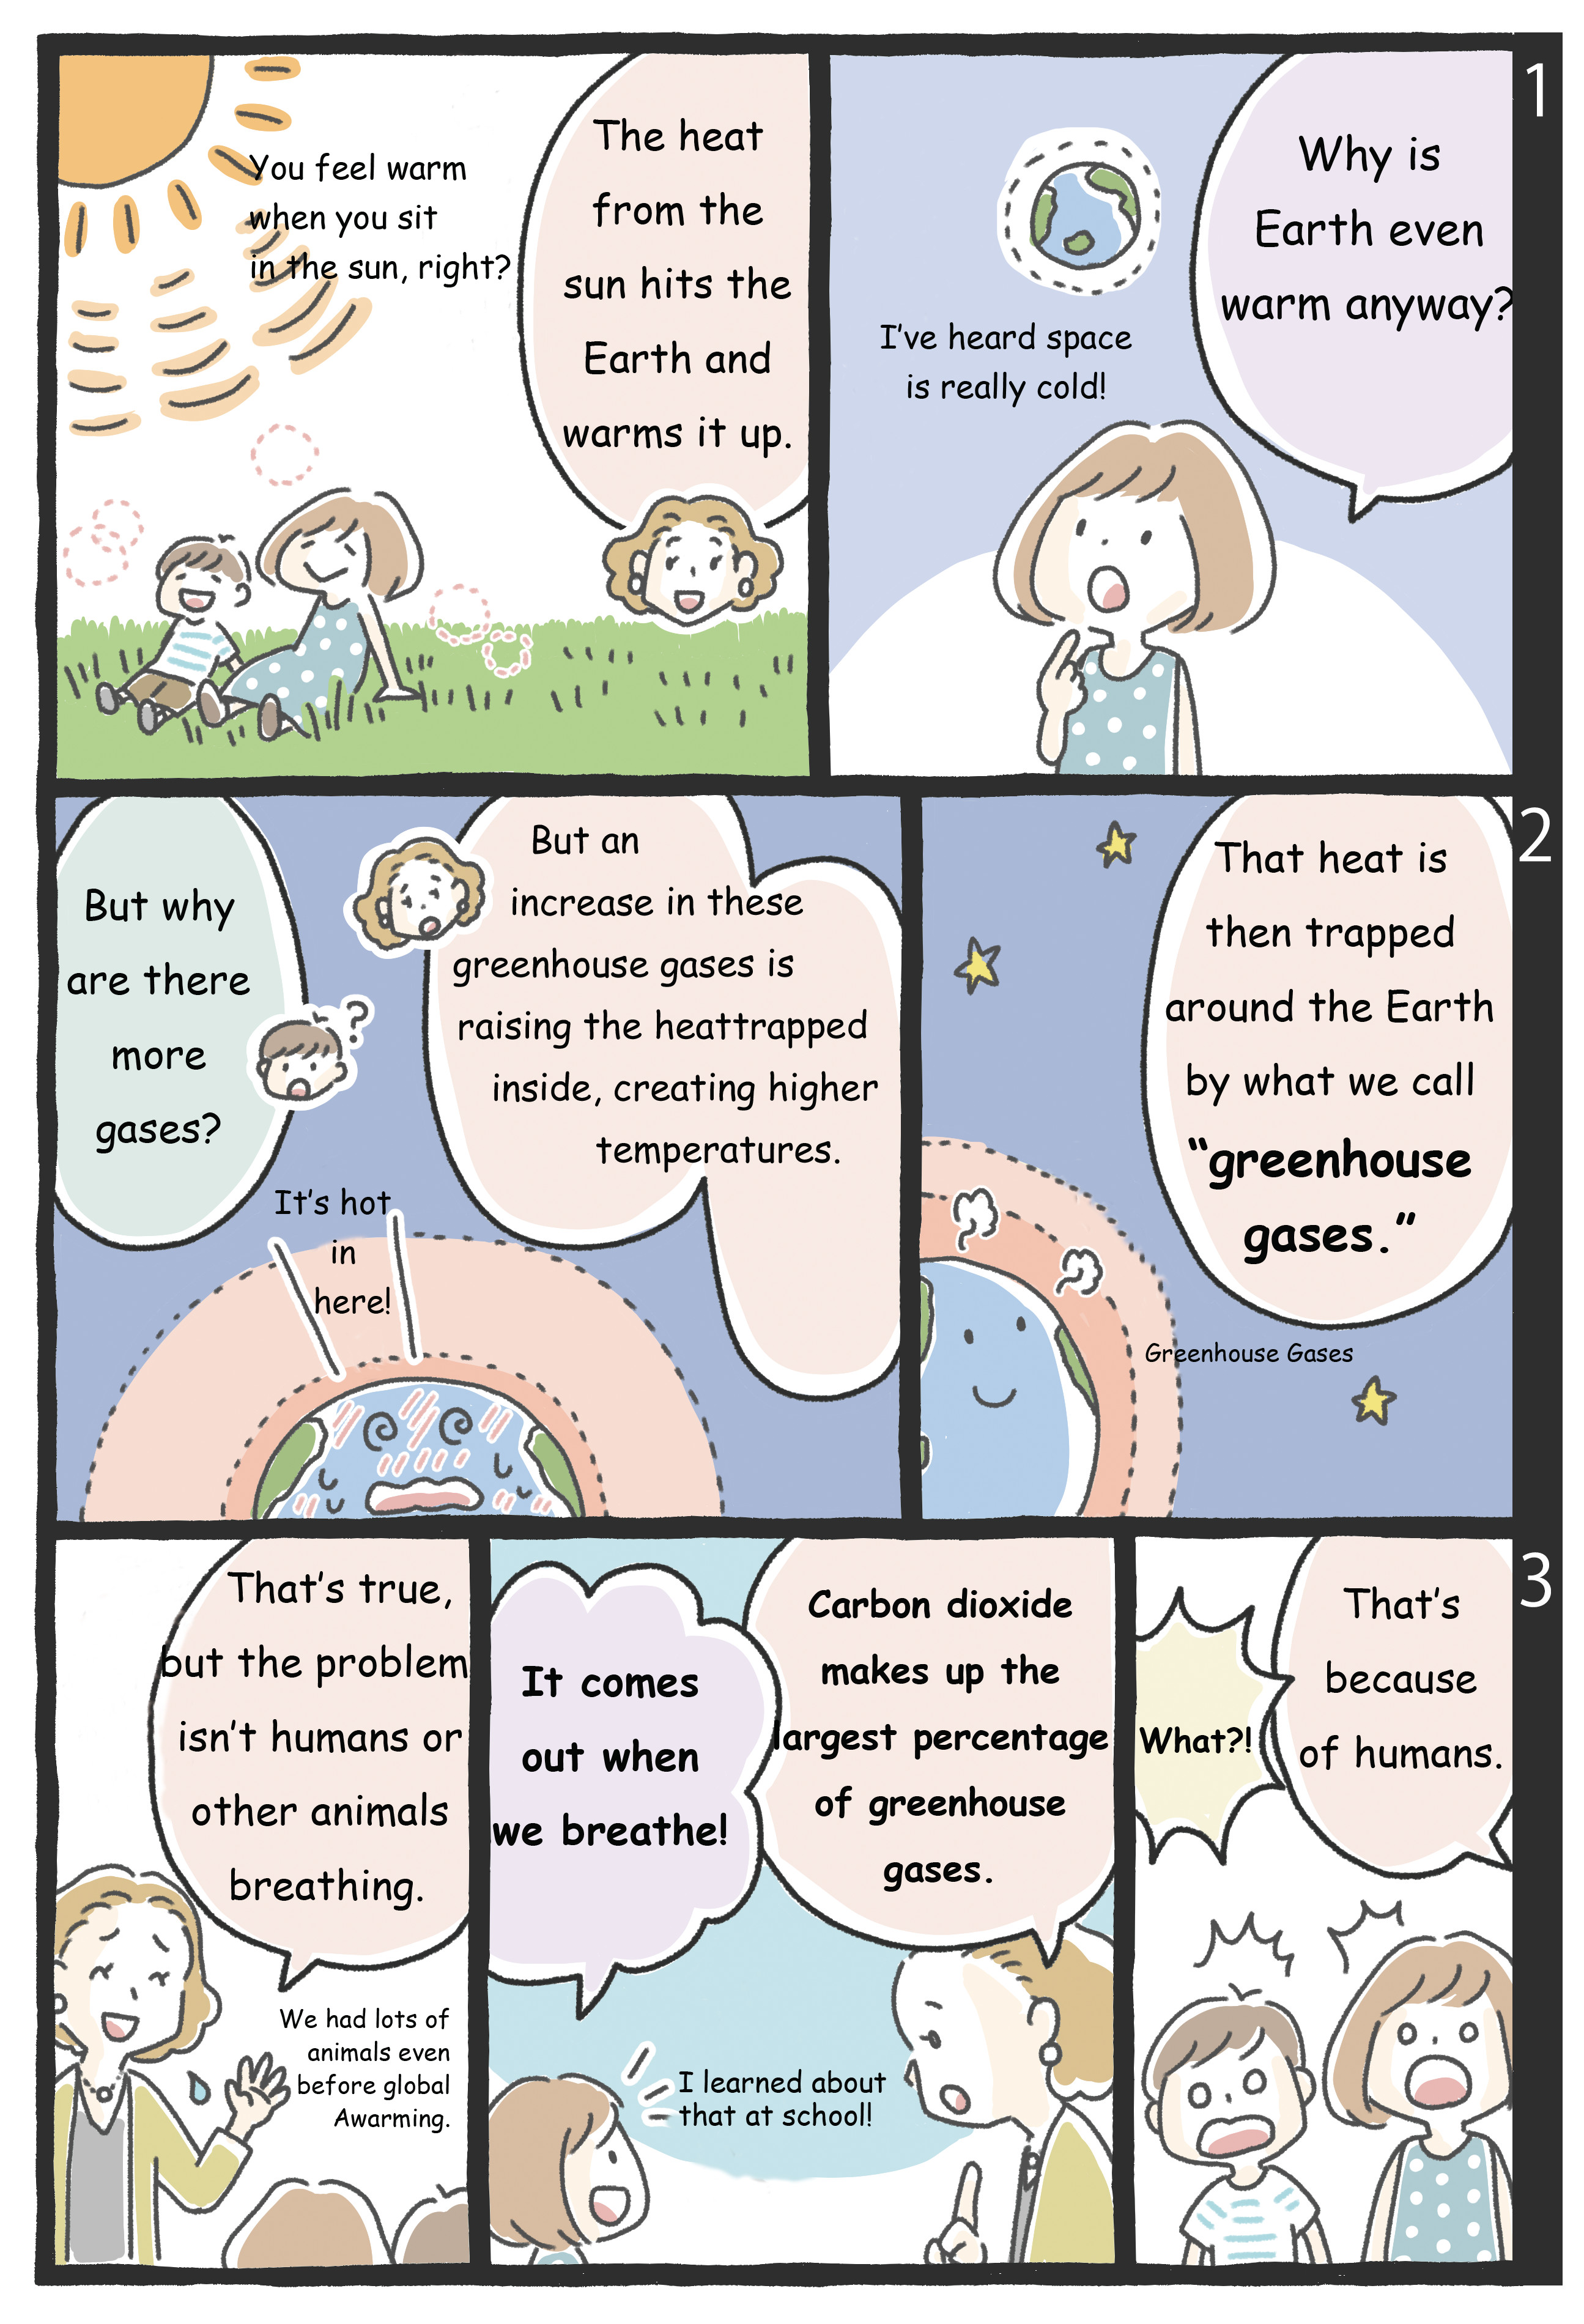
The Earth is a warm planet thanks to the sun. When the sun's rays hit the earth's surface, heat is generated, making our planet warm. That heat is released toward the sky and escapes into space, but certain gaseous elements within the atmosphere reflect this heat and stop it escaping. When the heat is repeatedly trapped, the earth becomes as warm as a greenhouse. These elements that continuously trap heat in the atmosphere are referred to as greenhouse gases.
The most common greenhouse gas is carbon dioxide, and it is produced when we burn what are known as fossil fuels, such as oil and coal.
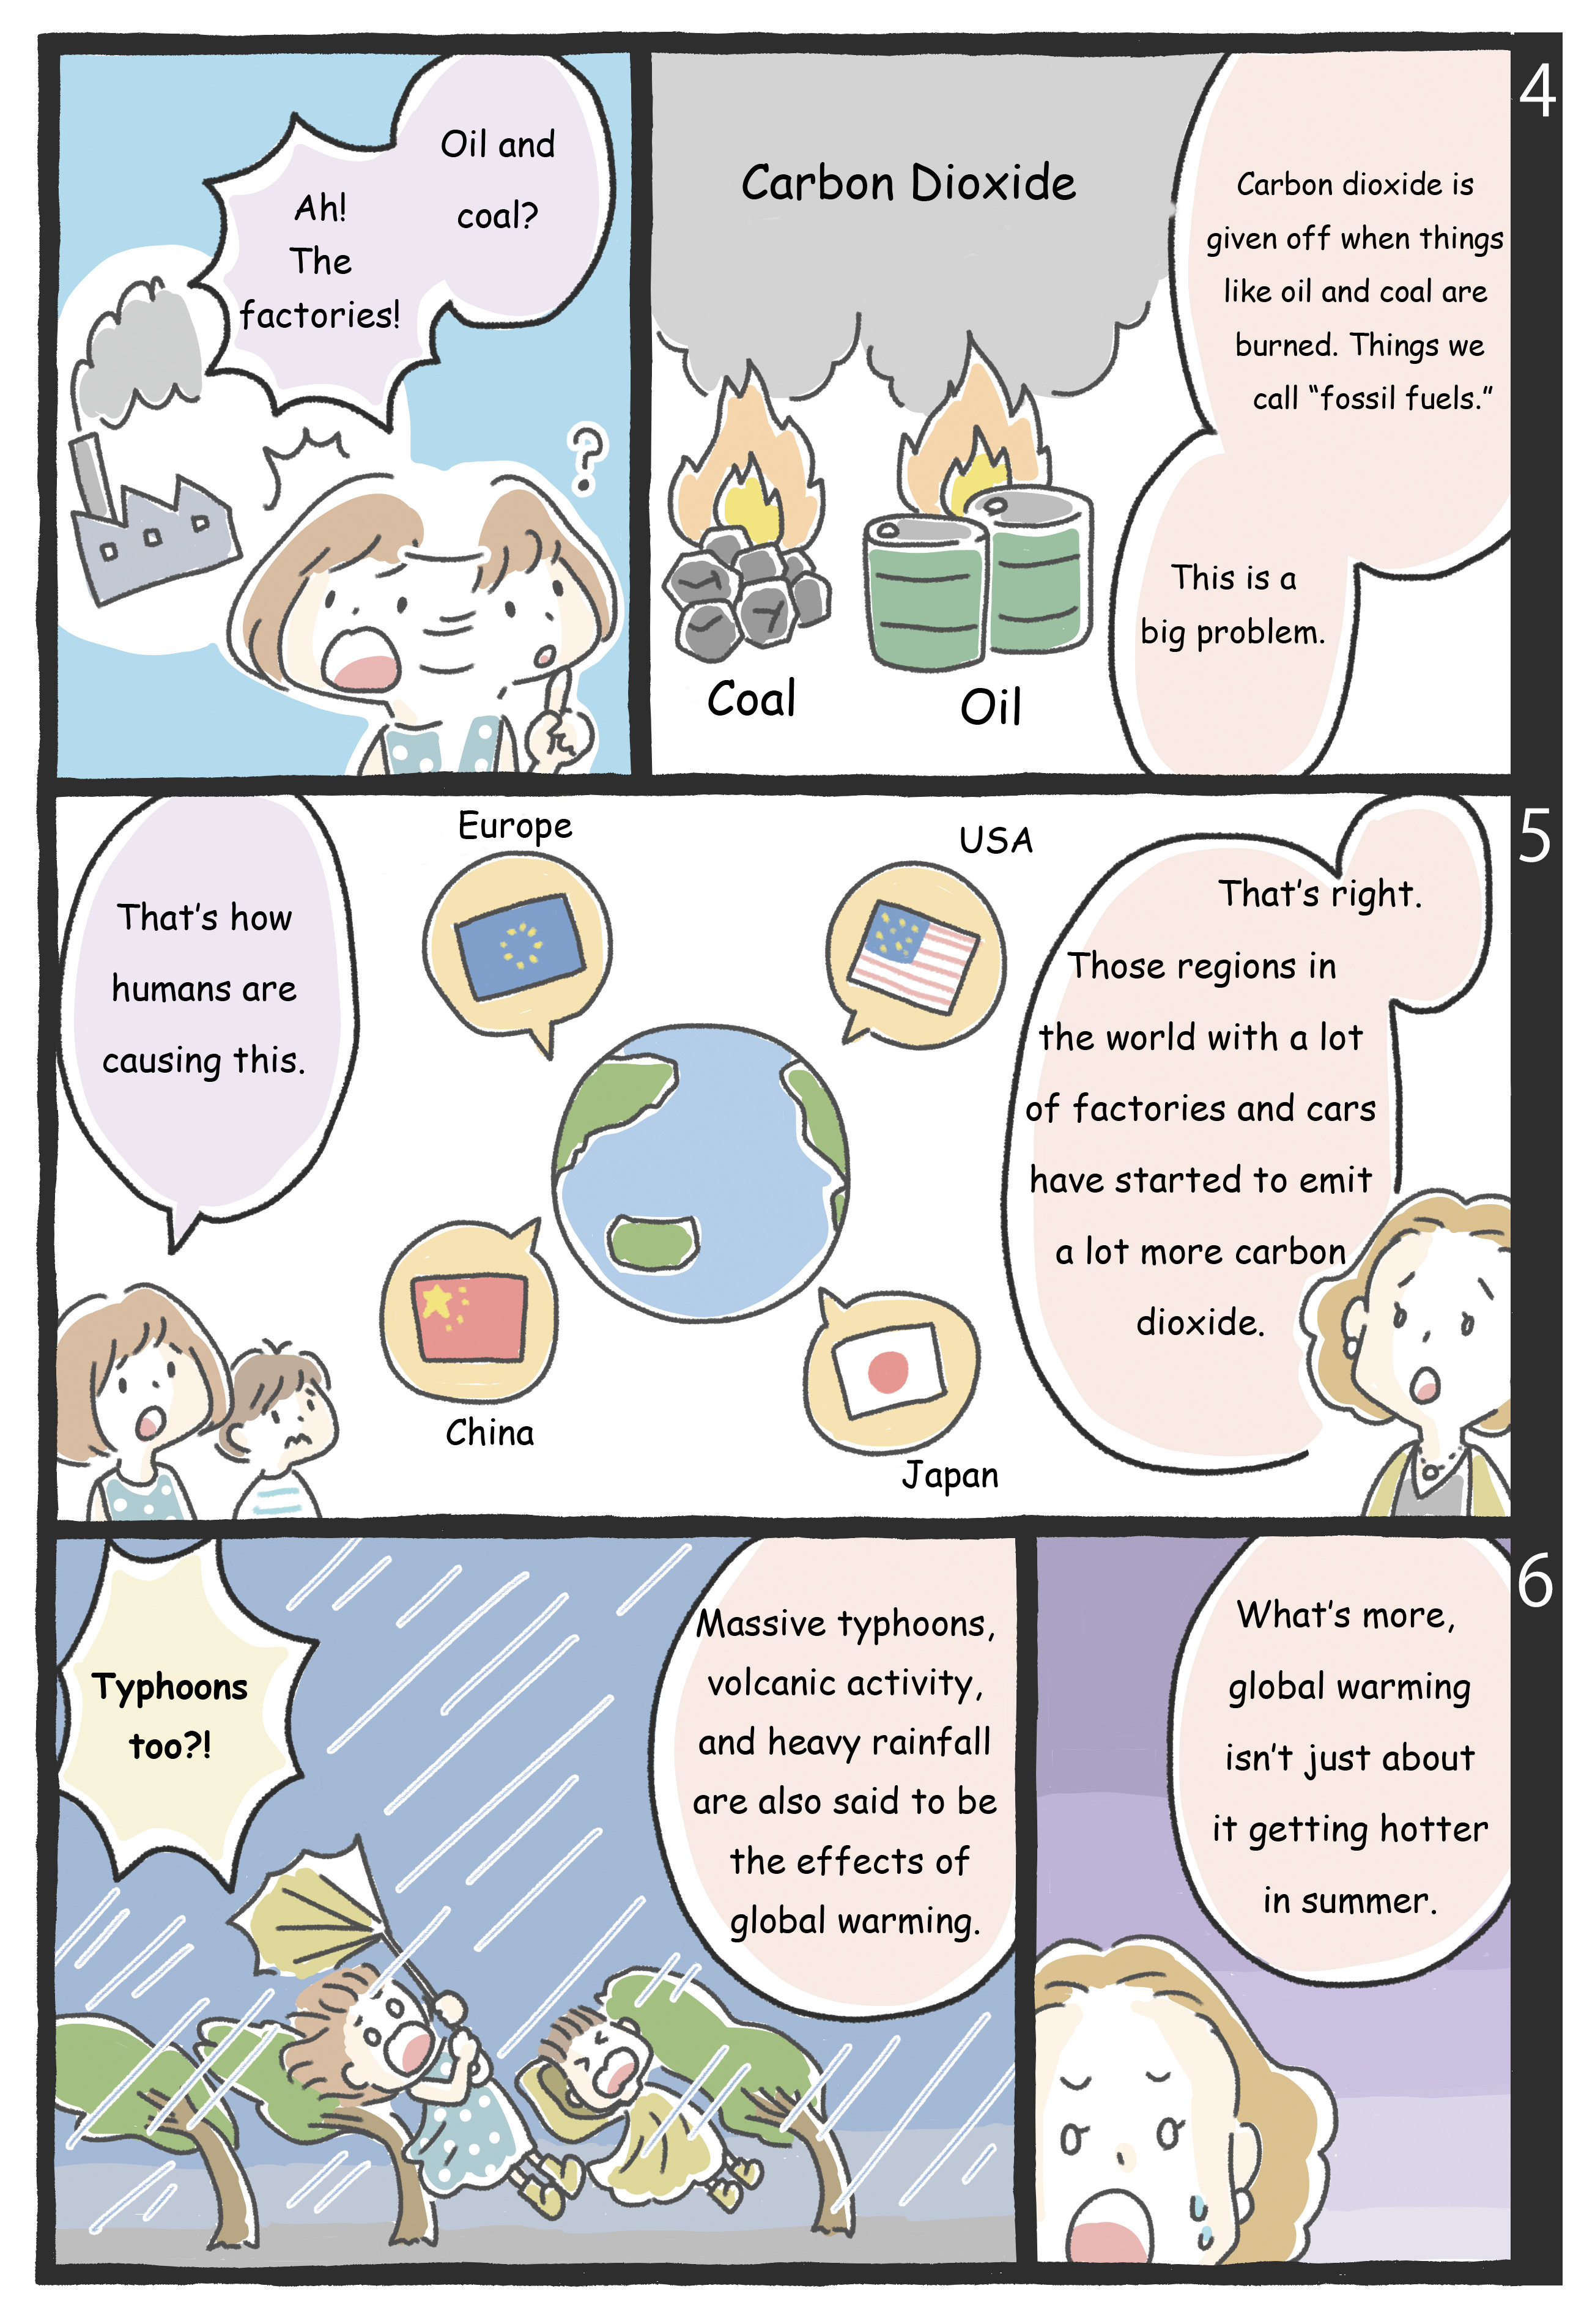
In the last 200 years or so of the Earth's long history, planetary temperatures have been rising rapidly. It is not because the light coming from the sun has become stronger. Rather, it is due to the increase of greenhouse gases in the composition of the atmosphere surrounding the earth.
Japan's Meteorological Agency has been monitoring the concentration of carbon dioxide in the air in places that are as sparsely populated as possible. The data shows that the concentration of carbon dioxide is rising every year. Looking at the world, the mid-to-high latitudes of the northern hemisphere, where Europe, China, the United States, and Japan are located, are particularly affected. This is where 80% of the world's population lives.
Currently, we are seeing increased occurrences of weather anomalies in these regions of high carbon dioxide concentration. Heat waves, extreme downpours, wildfires, super typhoons, and other extreme weather events are occurring in rapid succession. In Japan, annual precipitation figures show that there are years of extreme rainfall and years of continuous sunshine, and the changes are becoming more and more extreme.
The source of this extreme weather is the global warming caused by greenhouse gases.
episode 2
Heavy Rains, Heat Waves, and Extreme Weather Events are on the Rise
Can be read horizontally on a large screen
×
Detailed data and explanations 1:
Carbon dioxide is the main greenhouse gas.
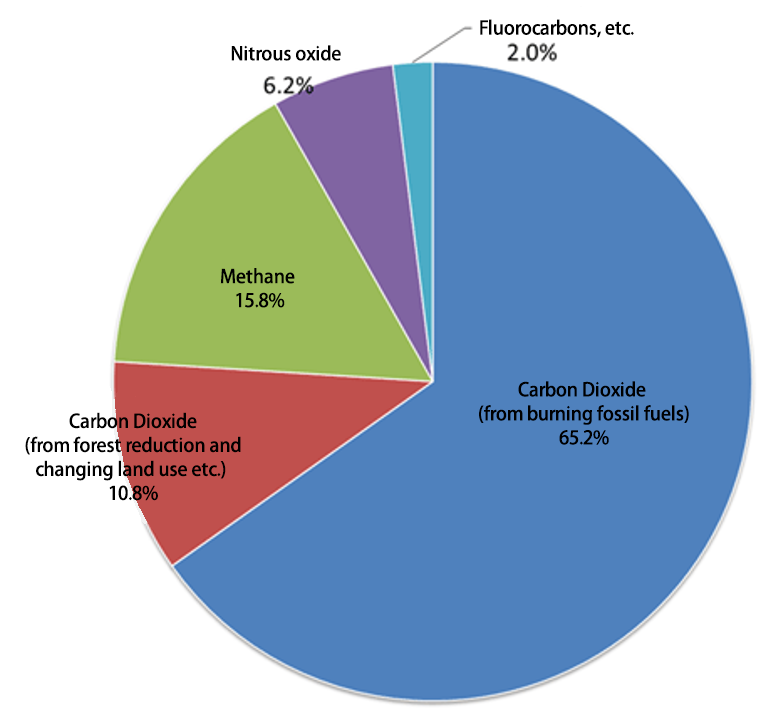
Percentage of total anthropogenic greenhouse gas emissions by gas type
Source: Japan Meteorological Agency Website
https://www.data.jma.go.jp/cpdinfo/chishiki_ondanka/p04.html
The rise in temperature caused by humans is due to greenhouse gases.
Greenhouse gases include carbon dioxide, methane, dinitrogen monoxide, and chlorofluorocarbons, of which, carbon dioxide accounts for the largest portion.
The graph above shows the percentage of each type of greenhouse gas emitted by human activities. It can be seen that carbon dioxide emitted from burning fossil fuels such as petroleum and coal accounts for most of the emissions.
Incidentally, methane can be found in the bubbles produced when plant matter decomposes in swamps and in the burps of cows.
Detailed Data and Explanation 2:
Carbon dioxide emissions in Japan are rising.
In Japan, the Japan Meteorological Agency is monitoring the concentration of carbon dioxide in the air. The locations for monitoring are Ryouri (Ofunato City, Iwate Prefecture), Minami-Torishima (Ogasawara Village, Tokyo), and Yonaguni Island (Yonaguni Town, Okinawa Prefecture). These locations were chosen because they are less affected by localized pollution from human activities. The data is graphed in the figure below.
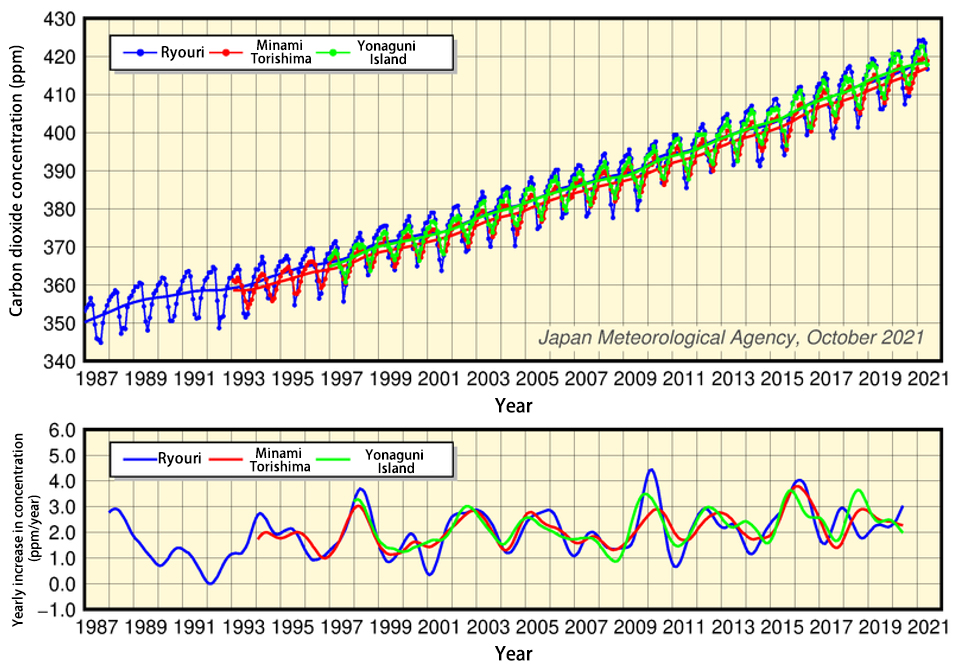
Source: Japan Meteorological Agency Website
http://ds.data.jma.go.jp/ghg/kanshi/ghgp/co2_trend.html#jma
The concentration of carbon dioxide in the air changes with the seasons.
In summer, plants are active in photosynthesis and the concentration decreases, but in winter, respiration and decomposition activities outpace photosynthetic activities and the concentration increases.
Thus, even taking into account seasonal fluctuations, overall, we can see that the concentration of carbon dioxide is rising steadily.
The graph of annual increase in concentration shows that it has been increasing every year at all of the observation sites, and there has been no year when it has decreased.
Detailed data and explanation 3:
Carbon dioxide concentration is increasing in the Northern Hemisphere.
Source: Japan Meteorological Agency
http://ds.data.jma.go.jp/ghg/kanshi/ghgp/co2_trend.html#jma
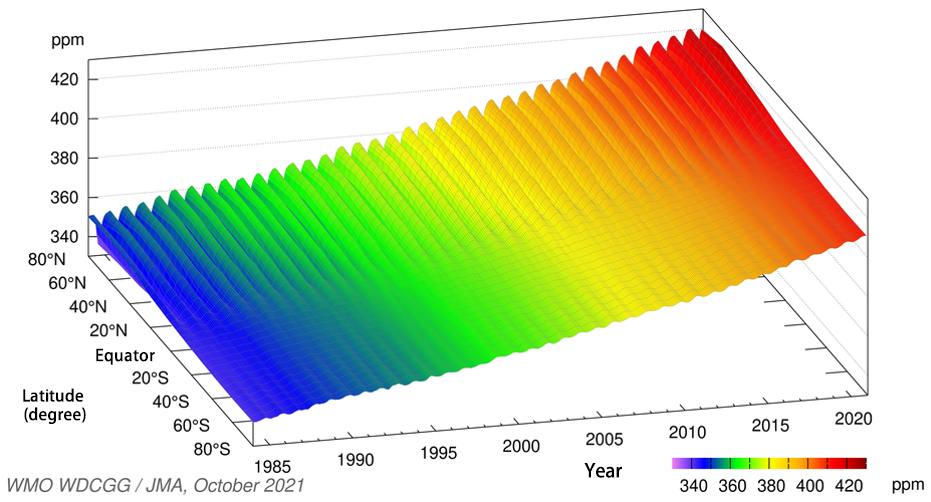
The above graph, created by the World Center for Greenhouse Gases (WDCGG), shows the change over time in the monthly average concentration of carbon dioxide in the atmosphere averaged by latitude zone.
It shows that concentrations are elevated in the mid and high-latitude zones of the Northern Hemisphere.
More than 80% of the world's population lives in the Northern Hemisphere, and it is in these higher latitude zones that human activity is most concentrated.
Clearly, more human activity releases more CO2, and the concentration of carbon dioxide has been gradually increasing over the years.
Detailed Data and Explanation 4:
Precipitation in Japan varies widely from year to year.
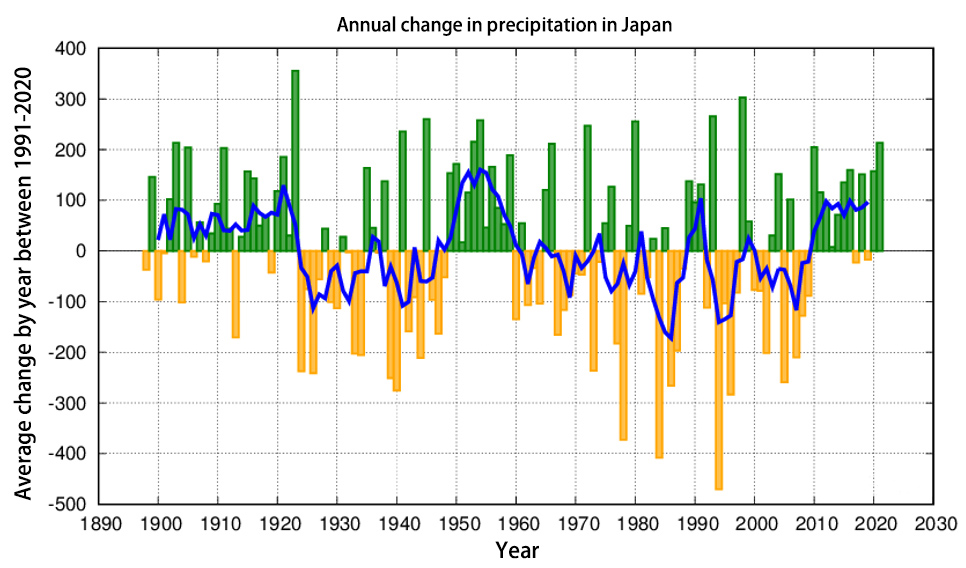
Bars: annual precipitation deviations from the base value;
Blue line: 5-year moving average of deviations.
The base value is the 30-year average from 1991 to 2020.
Source: Japan Meteorological Agency
https://www.data.jma.go.jp/cpdinfo/temp/an_jpn_r.html
The above graph shows the annual change in precipitation in Japan. It reveals that the annual variation has increased since the 1970s. It also shows that since 2010, Japan has been experiencing heavy rainfall seasons.